
Build Realtime AngularJS Dashboard with AngularJS and Bootstrap UI — Part 1
Building a Realtime AngularJS Dashboard using AngularJS and Bootstrap UI — Part 1
In the last tutorial series, “Building a Realtime AngularJS Dashboard using Spring Rest and MongoDB — Part 1, Part 2, Part 3” we covered how to configure and set up Spring MVC for use as RESTful API using MongoDB for our datastore. In addition, we made extensive use of the SIGAR libraries to gather system statistics from the host operating system where the services reside. In this tutorial series, our focus will be on the User Interface (UI) using AngularJS, Bootstrap, and the various Javascript Charting and Graphing Libraries (Sparkline, NVD3, ChartJS, JustGage, and CanvGauge).
Why Build a Dashboard?
Dashboards are meant to provide “situational awareness” of sales, marketing, human resources, operational or production processes. Their main focus is to provide key data that must be monitored by the business in order for it to be aware of what is happening in the system.
The term dashboard originated in the automobile industry with automobiles dashboards. Drivers use the dashboard to monitor all of the car’s major functions using the instrument panels in the dashboard. Dashboards provide some signs about how key functions and/or processes are working and will alert the users in the event of problems or failures.
Key Elements of Good Dashboard Design
- Communicates Effectively
- Provides business with useful information
- Provides visual presentation of information
- Has minimum distractions
Our Realtime Dashboard AngularJS Application

Getting Started
In order to run this tutorial yourself, you will need the following:
- Java JDK 1.6 or greater
- Spring Tool Suite (STS)
- Tomcat 7 or greater or other popular container (Weblogic, Websphere, Glassfish, JBoss, VMWare vFabric, etc). For this tutorial I am using VMware vFabric tc Server Developer Edition which is essentially an enhanced Tomcat instance integrated with Spring STS
- Spring Framework 4.0.6
- Spring Data Mongo 1.6.1
- MongoDB NoSQL Database 3.0
- AngularJS
- Bootstrap
- Sigar (System Information Gatherer And Reporter)
- jQuery Sparkline
- Nvd3 Charting
- ChartJS
- Just Gage
Project Overview (User Interface)
I have added the project overview from a user interface perspective to give you a view of the structure and show you some of the key files in the project.

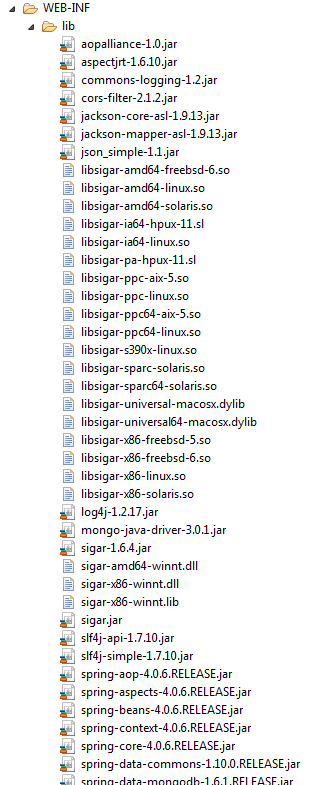
WEB-INF\Lib Folder Structure
I have included the folder structure because I would recommend including all of the SIGAR files as part of your WAR file. This library includes of the native libraries for the specific operating systems. If you do not wish to include the SIGAR libraries inside your package you will need to ensure that the Java Library Path contains the correct path to the location of the SIGAR libraries using:
-Djava.library.path=../path/lib/sigar/lib.
RESTful Web Service End Points
| # | URI | Method | Description |
|---|---|---|---|
| 1 | /status | GET | Returns a simple HTML output of server status |
| 2 | /statistics | GET | Returns statistics used in the four upper panels of the Dashboard UI from MongoDB repository |
| 3 | /cpu | GET | Retrieves details on CPU, processes, memory and swap space as well as historical running data |
| 4 | /osdetails | GET | Retrieves details on Operating System and Java Virtual Machine (JVM) |
| 5 | /getallnetworkinterfaces | GET | Finds all network interfaces that are available |
| 6 | /getnetworkstats?interface={interface} | GET | Retrieves statistics on network interface like speed, rxBytes, txBytes, packets, collisions, errors, etc |
| 7 | /networkdetails?interface={interface} | GET | Retrieves details of the network interface like name, type, flags, description, MAC address, etc |
| 8 | /getalldisks | GET | Retrieves a list of all available disks or devices that are mapped or available |
| 9 | /diskdetails?drive={drive} | GET | Provides details on drive specified including available bytes, disk reads, free bytes, total bytes, and percentage used |
| 10 | /heartbeat | GET | Returns the current count of heartbeat from the server |
| 11 | /resetheartbeat | GET | Resets the count of the heartbeat back to one (1) |
The View
The view represents the presentation layer in the User Interface. In our web application, we have decided to use the Gentelella Admin template as a starting point. Extensive changes have been made to this excellent template.
The first this we do in the page is get the protocol and the hostname from the URL. In addition, we read the debug parameter, if it exists for possible debugging information to be logged to console from the application.
<%
  String fullProtocol = request.getProtocol().toLowerCase();
  String protocol[] = fullProtocol.split("/");
  String baseUrl = protocol[0] + "://" + request.getHeader("Host");

  boolean isDebug = false;
  String debugParam = request.getParameter("debug");
  if (debugParam != null && (debugParam.toLowerCase().equals("true")
	    || debugParam.toLowerCase().equals("yes")
      || debugParam.equals("1"))) {
    isDebug = true;
  }
%>
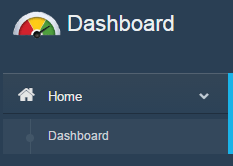
Set up the Sidebar Navigation
The sidebar menu is coming back into fashion especially for administrative dashboards. The main difference between this navigation element and the ones designed during the early days of the web is the dynamic element that is available nowadays. Using jQuery and CSS this dynamic element usually has some clever animation associated with it — in our case, we are able to minimize the footprint associated with the sidebar. For my dashboard example, I have only added the Home and Dashboard, but you can easily modify for your own needs and add some additional features.
<div class="col-md-3 left_col">
<div class="left_col scroll-view">
<div class="navbar nav_title" style="border: 0;">
<a href="index.jsp" class="site_title"> <span
class="image_icon"><img src="images/dashboardIcon.png"
alt="logo" /></span> <span>Dashboard</span>
</a>
</div>
<div class="clearfix"></div>
<!-- menu profile quick info -->
<div id="sidebar-menu"
class="main_menu_side hidden-print main_menu">
<div class="menu_section">
<h3> </h3>
<ul class="nav side-menu">
<li><a><i class="fa fa-home"></i> Home <span
class="fa fa-chevron-down"></span></a>
<ul class="nav child_menu" style="display: none">
<li><a href="index.jsp">Dashboard</a></li>
</ul></li>
</ul>
</div>
</div>
</div>
</div>
Set up the Top Navigation
For this dashboard, we have also added a Top Navigation. The left-most menu element containing the three bars will toggle the sidebar visibility from a full sidebar to a compressed or minimized sidebar view — allowing for more content being displayed in the content area of the dashboard. The next item is the speaker icon which will allow you to mute the sounding of the alarm that gets triggered when the server is down or otherwise unreachable — something that can be simulated by the bomb icon. The lightning bolt icon will allow us to simulate some server errors being published from the back-end server. The bell icon is simulating some alerts with bubble available to the user of the dashboard. The last icon is a caret which displays a drop-down menu. All of these items are available for display purposes only and can easily be removed if not required by the user.
Please note that I am using the animate library, using the fadeInDown effect when menu appears, to make menus appear more pleasing to the end user.

<div class="top_nav">

  <div class="nav_menu">
    <nav class="" role="navigation">
      <div class="nav toggle">
        <a id="menu_toggle" data-toggle="tooltip" data-placement="right"
          title="Toggle Sidebar"> <i class="fa fa-bars"></i>
        </a>
      </div>

      <ul class="nav navbar-nav navbar-right">
        <li class=""><a href="test.html"
          class="user-profile dropdown-toggle" data-toggle="dropdown"
          aria-expanded="false"> <span class=" fa fa-angle-down"></span>
        </a>
          <ul role="menu"
            class="dropdown-menu dropdown-usermenu animated fadeInDown pull-right">
            <li><a href="javascript:;"> Profile</a></li>
            <li><a href="javascript:;"> <span>Settings</span>
            <span class="badge bg-red pull-right">30%</span>
            </a></li>
            <li><a href="javascript:;">Help</a></li>
            <li><a href="javascript:;">
            <i class="fa fa-sign-out pull-right"></i> Log Out</a></li>
          </ul></li>

        <li role="presentation" class="dropdown"><a
          href="javascript:;" class="dropdown-toggle info-number"
          data-toggle="dropdown" aria-expanded="false"> <i
            class="fa fa-bell"></i> <span class="badge bg-red">6</span>
        </a>
          <ul id="menu1"
            class="dropdown-menu list-unstyled msg_list animated fadeInDown"
            role="menu">
            <li><a> <span class="image"> <img
                  src="images/users/amaury.png" alt="Profile Image" />
              </span> <span> <span>Amaury Valdes</span> <span class="time">7
                    mins ago</span>
              </span> <span class="message"> Dashboard has been running
                  without any problems for several weeks... </span>
            </a></li>
            <li><a> <span class="image"> <img
                  src="images/users/amaury.png" alt="Profile Image" />
              </span> <span> <span>Amaury Valdes</span> <span class="time">39
                    mins ago</span>
              </span> <span class="message"> Noticed some some
                  inconsistencies in the data. Will mention to Management... </span>
            </a></li>
            <li><a> <span class="image"> <img
                  src="images/users/amaury.png" alt="Profile Image" />
              </span> <span> <span>Amaury Valdes</span> <span class="time">3
                    hours ago</span>
              </span> <span class="message"> We are planning on releasing
                  the final version of the dashboard next week... </span>
            </a></li>
            <li><a> <span class="image"> <img
                  src="images/users/amaury.png" alt="Profile Image" />
              </span> <span> <span>Amaury Valdes</span> <span class="time">2
                    days ago</span>
              </span> <span class="message"> Still working on some last
                  minute changes that I think will add to the WOW factor... </span>
            </a></li>
            <li>
              <div class="text-center">
                <a> <strong>See All Alerts</strong> <i
                  class="fa fa-angle-right"></i>
                </a>
              </div>
            </li>
          </ul></li>
        <li><a id="bolt" data-toggle="tooltip"
          data-placement="bottom" title="Simulate Log File Error"
          href="javascript:createAlert();"
          class="dropdown-toggle info-number"><i class="fa fa-bolt"></i></a></li>
        <li><a id="bomb" data-toggle="tooltip"
          data-placement="bottom" title="Simulate Server Down"
          ng-click="causeHeartbeatError()"
          class="dropdown-toggle info-number"><i class="fa fa-bomb"></i></a></li>
        <li><a id="speaker" data-toggle="tooltip"
          data-placement="bottom" title="Mute Alarm"
          ng-click="muteHeartbeatError()"
          class="dropdown-toggle info-number"> <i
            ng-show="!alert_sound.mute"
            class="glyphicon glyphicon-volume-up"></i> <i
            ng-show="alert_sound.mute"
            class="glyphicon glyphicon-volume-off"></i>
        </a></li>
      </ul>
    </nav>
  </div>

</div>
Setting up the Top Statistics Tiles
The top four tiles are meant to display key statistical information to the users of the dashboard. By placing them at the top of the dashboard with colorful info-graphics will ensure they garnish attention from the user. The information for these tiles comes from MongoDB datasource and will be refreshed periodically.
tile-stats CSS class
The first thing you will notice about the Top Statistics Tiles is that each of them are associated to a tile-stats class which gives the tiles their general characteristics like shape of corners, color of tiles, initial animation effects, etc. The next thing you notice is that each of them contains a large number which is determined by the count class. Additionally, you will notice that each of these tiles has an image associated with it. By using the image class, it will be placed at an absolute location within the tile. In our case, it is placed 12 pixels from the top and 23 pixels from the right of the tile. Next we have the heading the tile using an H3 markup. Finally, we have the text associated with the tile just to offer some additional explanation as details of the tile statistics being displayed. I would like to delve a little deeper for the System Heartbeat tile as there are some subtle differences with that one as compared to the others.
CSS Tile Stats Image class
.tile-stats {
	position: relative;
	display: block;
	margin-bottom: 12px;
	border: 1px solid #E4E4E4;
	-webkit-border-radius: 5px;
	overflow: hidden;
	padding-bottom: 5px;
	-webkit-background-clip: padding-box;
	-moz-border-radius: 5px;
	-moz-background-clip: padding;
	border-radius: 5px;
	background-clip: padding-box;
	background: rgba(10, 130, 240, 0.08);
	 -moz-transition: all 300ms ease-in-out;
	-o-transition: all 300ms ease-in-out;
	-webkit-transition: all 300ms ease-in-out;
	transition: all 300ms ease-in-out;
}
CSS Tile Stats Image class
.tile-stats .image {
	color: #BAB8B8;
	position: absolute;
	right: 23px;
	top: 12px;
	z-index: 1;
}
System Heartbeat Tile
This tile is especially active and animated as I wanted the heartbeat to actually pulse on every successful count retrieval from the server and I also wanted to tile to change color to red if we lost connectivity to the server at any point in time. In order to accomplish both tasks you will notice a directive on the div tag animate-on-change with an angular variable called $scope.heartbeat.count. This directive will set up a watch on a $scope reference for the variable heartbeat.count. In the event that the value changes if will trigger me to add the ‘heartbeat animated pulse image’ classes to the image. Causing it to pulse two times, followed by me removing the classes ‘heartbeat animated pulse’. This causes the image only to pulse when data changes and not repeatedly.
AngularJS Directive animateOnChange
app.directive('animateOnChange', ['$animate', '$timeout',
                                  function($animate, $timeout) {
  return function(scope, elem, attr) {
    scope.$watch(attr.animateOnChange, function() {
      $animate.addClass(elem,
			       'heartbeat animated pulse image').then(function() {
        $timeout(function(){
          $animate.removeClass(elem, 'heartbeat animated pulse');
        }, 0);
      });
    });
  };
}]);
The other thing that will happen to this tile should connectivity be lost to the server, is that the entire tile will flash RED. This is handled by another AngularJS directive called error-condition. Again, this directive, like the previous one sets up a watch on a variable called heartbeat.error. Should this variable become true we will modify the tile to contain ’tile-stats-error front pulser animated flash’ classes instead of the normal ’tile-stats front pulser’ classes. These classes will cause the tile to flash continually red (different intensities) until connectivity gets restored.
AngularJS Directive errorCondition
app.directive('errorCondition', ['$animate', function($animate) {
  return function(scope, elem, attr) {
    scope.$watch(attr.errorCondition, function(value) {
      if (value == true) {
        $animate.removeClass(elem, 'tile-stats front pulser');
        $animate.addClass(elem,
				      'tile-stats-error front pulser animated flash ');
      } else {
        $animate.removeClass(elem,
				       'tile-stats-error front pulser animated flash');
        $animate.addClass(elem, 'tile-stats front pulser');
      }
    });
  };
}])

<div class="row top_tiles" id="row-1">
  <div id="card-1" class="col-lg-3 col-md-3 col-sm-6 col-xs-12">
    <div class="tile-stats">
      <div class="image">
        <img src="images/api-icon.png" alt="api" />
      </div>
      <div class="count">{{dashboard.today_count}}</div>
      <h3>{{dashboard.today_heading}}</h3>
      <p>{{dashboard.today_avg}} Daily Average Duration</p>
    </div>
  </div>
  <div id="card-2" class="col-lg-3 col-md-3 col-sm-6 col-xs-12">
    <div class="tile-stats">
      <div class="image">
        <img src="images/associate.png" alt="associate" />
      </div>
      <div class="count">{{dashboard.onboarded_count}}</div>
      <h3>{{dashboard.onboarded_heading}}</h3>
      <p>Number of users recently hired</p>
    </div>
  </div>
  <div id="card-3" class="col-lg-3 col-md-3 col-sm-6 col-xs-12">
    <div class="tile-stats">
      <div class="image">
        <img src="images/bar-graph.png" alt="graph" />
      </div>
      <div class="count">{{dashboard.signups_count}}</div>
      <h3>{{dashboard.signups_heading}}</h3>
      <p>Number of users pending hire</p>
    </div>
  </div>
  <div id="card-4"
    class="animated col-lg-3 col-md-3 col-sm-6 col-xs-12">
    <div error-condition="heartbeat.error" class="tile-stats pulser"
      id="front-4">
      <div animate-on-change="heartbeat.count"
        class="heartbeat animated pulse image">
        <img src="images/heart-48.png" alt="heart" />
      </div>
      <div class="count">{{ heartbeat.count }}</div>
      <h3>System Heartbeat</h3>
      <p>Monitors system availability</p>
    </div>
  </div>
</div>
Let’s View the Realtime AngularJS Dashboard GUI Screens
As you can see from the following screenshots, the UI is quite appealing in its design.


Associated Posts
- Building a Realtime AngularJS Dashboard using Spring Rest and MongoDB -- Part 1
In this tutorial we will cover implementing a Dashboard application using Periodic Refresh Pattern (Polling) via AJAX calls from AngularJS. - Building a Realtime AngularJS Dashboard using Spring Rest and MongoDB -- Part 2
The second part tutorial continues where the first left off and continues diving into the code base. - Building a Realtime AngularJS Dashboard using Spring Rest and MongoDB -- Part 3
In this last of three part tutorial finish up our deep dive and reveal the finishing touches to our real-time application. - Build Realtime AngularJS Dashboard with AngularJS and Bootstrap UI — Part 1
In this tutorial series, our focus will be on the User Interface (UI) using AngularJS, Bootstrap, and the various Javascript Charting and Graphing Libraries (Sparkline, NVD3, ChartJS, JustGage, and CanvGauge). - Build Realtime AngularJS Dashboard with AngularJS and Bootstrap UI — Part 2
The second part tutorial continues looking at the user interface (UI) components where the first left off and continues diving into the code base. - Build Realtime AngularJS Dashboard with AngularJS and Bootstrap UI — Part 3
In this last of three part tutorial finish up our deep dive into the UI and reveal the finishing touches to our real-time application.

Leave a Reply